How to Choose a Treatment Plant in 2026?
Choosing a Treatment Plant in 2026 means looking beyond its advertised capacity. The right choice must fit your source water or wastewater, daily flow swings, discharge requirements, site limits, and available operators. Small details matter: a sharp seasonal change in influent, limited space for sludge handling, or a long wait for replacement parts can undermine an otherwise impressive design.
The need is substantial. WHO and UNICEF reported that 2.2 billion people lacked safely managed drinking water in 2022. The U.S. EPA’s 2024 Clean Watersheds Needs Survey estimated $630.1 billion in wastewater and stormwater infrastructure needs over the following 20 years. These figures describe broad service and infrastructure gaps, not a guaranteed market or the cost of one facility. Water scientist Peter Gleick captured the management challenge: “The world’s water crisis is not about having too little water to satisfy our needs. It is a crisis of managing water so badly that billions of people—and the environment—suffer badly.” His warning is relevant to plant selection: equipment alone cannot solve a planning problem.
A sound comparison should test lifecycle cost, energy demand, treatment performance, residuals management, expandability, and local service support. Ask vendors for performance data from comparable projects, not just ideal design conditions. Check what happens when flow doubles after a storm—or falls during a dry spell. Visit an operating facility, if possible. I would not treat a spreadsheet as proof; assumptions about power prices, staffing, and maintenance can be wrong. That uncertainty deserves attention. A resilient Treatment Plant is not necessarily the most advanced one. It is the one that can reliably meet its intended performance, with the people, budget, and support available on site.
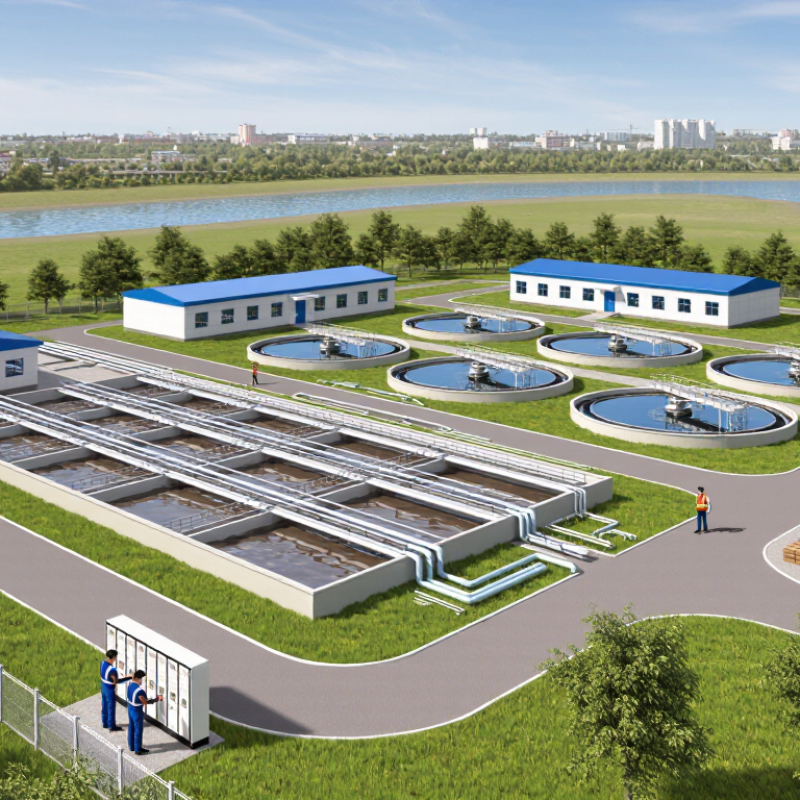
Define the Plant’s Duty: Match Design Flow to Average and Peak Loads
How to Choose a Treatment Plant in 2026?
Define the Plant’s Duty: Match Design Flow to Average and Peak Loads
A plant’s duty starts with measured flow, not a population forecast alone. The U.S. EPA’s 2004 Primer for Municipal Wastewater Treatment Systems uses roughly 100 gallons per person per day as a common domestic wastewater estimate. For 10,000 people, that suggests about 1.0 million gallons daily. It is a starting point, not a site-specific design value. Commercial users, seasonal visitors, and water conservation can shift the actual number.
Track average, maximum-day, and peak-hour flows separately. A hypothetical plant averaging 1.0 million gallons daily might see a 2.2-million-gallon peak hour during a wet morning. That brief surge can affect pumps, screens, clarifiers, and disinfection. The Great Lakes–Upper Mississippi River Board’s Recommended Standards for Wastewater Facilities advises considering flow variation and infiltration when establishing design capacity. Pair flow meters with rainfall records and influent strength data, such as BOD and suspended solids. A high-flow reading alone does not describe the whole treatment load.
One question deserves a second look: are the recorded peaks real, or are meters missing short surges? Review several seasons of data before fixing capacity. Oversizing can waste energy; undersizing can leave little room during storms or growth. The balance is not always neat.
Characterize Influent: Test BOD₅, TSS, Nutrients, and Flow Variability
Choosing a treatment plant starts with knowing what enters it. Collect representative influent samples during weekday mornings, evenings, and wet-weather events. A single grab sample can miss sharp changes. Use composite samples when practical, and record the time, weather, and operating conditions beside each result. Test BOD₅, TSS, and nutrients such as ammonia and phosphorus. These measurements inform process needs, not just equipment size.
Track flow with calibrated meters. Record average, peak-hour, and minimum flows over several weeks, ideally across seasonal shifts. A plant designed around daily average flow may struggle during a brief storm surge. Compare concentrations with mass loading; dilution can make results look reassuring while pollutant loads remain high. Check laboratory methods, detection limits, and sample handling. Small errors matter.
If influent readings vary widely, investigate the source before choosing a process. Separate domestic, commercial, and industrial contributions where feasible; their timing may differ. Ask operators about odors, settling solids, and unusual discharge patterns, then verify observations with measurements. Data gaps happen. Document them honestly, and account for uncertainty rather than treating an incomplete record as reliable.
How to Choose a Treatment Plant in 2026?
Characterize Influent: Test BOD₅, TSS, Nutrients, and Flow Variability
This illustrative profile shows hourly flow as a factor of average daily flow; a value of 1.0 equals the daily average. Actual patterns vary by site, so use flow-meter data to identify peak flows and fluctuations. For preliminary context, typical untreated municipal influent ranges are approximately BOD₅ 150–300 mg/L, TSS 150–350 mg/L, total nitrogen 20–50 mg/L, and total phosphorus 4–10 mg/L. Confirm design values with representative sampling and site-specific testing.
Assess Site, Sludge, Energy, and Whole-Life Operating Costs
A treatment plant must suit the site, not just the flow diagram. Check ground conditions, flood exposure, access for maintenance vehicles, and room for future upgrades. A narrow access road can make routine sludge removal costly. Seasonal flows matter, too: a plant sized only for average demand may struggle during wet-weather peaks. Ask for design assumptions, expected performance ranges, and operating data from comparable installations. Treat projections as estimates, not guarantees.
Sludge can quietly dominate operating costs. Compare expected volumes, dewatering needs, storage time, and the actual distance to an available receiving facility. Then examine energy use by process, especially aeration and pumping. Request consumption estimates at both average and peak load, and check local electricity tariffs. Look beyond construction costs. Include staffing, chemicals, maintenance, replacement parts, sludge transport, and planned equipment renewals across the plant’s service life. That matters. Compare options using the same lifespan, flow assumptions, and cost basis. No spreadsheet captures every disruption; a blocked haul route or unexpected maintenance visit can change the picture. Keep a contingency allowance, and revisit the assumptions before choosing.
Verify Discharge Compliance: EPA Secondary Standards Require pH 6–9
How to Choose a Treatment Plant in 2026?
A treatment plant must meet more than its expected flow and capacity. Check how it will keep discharged water within the required pH range. EPA secondary treatment standards specify pH from 6.0 to 9.0. That range is important, but it may not tell the whole story. The facility’s discharge permit and local requirements can set additional conditions. Ask for the applicable limits before comparing equipment.
pH can shift when the incoming wastewater changes. A sudden acidic load, for example, may move a reading outside the permitted range. Look for a system with suitable monitoring, dependable chemical dosing, and clear alarms. Ask how often sensors need calibration and how operators can verify readings. It is tempting to treat pH as a checkbox. That can be a costly assumption.
Request sample operating records or performance data from comparable applications, and ask how the plant responds to flow changes. A test with stable feed may not reflect a difficult operating day. Check whether the design includes accessible sampling points and enough room for maintenance. Also confirm who will train operators and document calibration, adjustments, and discharge results. Small details matter. Even a well-sized plant needs consistent checks to support compliance.